Abstract
Test-time prompt tuning (TPT) improves CLIP’s accuracy on a single test image but makes its predictions overconfident. Most fixes (C-TPT, O-TPT, A-TPT, SoC) add a regularizer that spreads the class text embeddings apart during prompt tuning. They lower ECE but also lose part of TPT’s accuracy gain, sometimes almost all of it. The only post-hoc method, SaLS, keeps accuracy but removes little of the calibration error.
The paper starts from two facts: zero-shot CLIP is already well calibrated, and TPT changes accuracy only a little, so most of the extra error comes from inflated confidence. A pilot test that simply gives each TPT prediction its zero-shot confidence already lowers ECE a lot. CoTS (Confidence-based Temperature Scaling) makes this consistent: after TPT, it learns a temperature on the test image’s own augmented views so that the adapted confidence matches the zero-shot confidence. E-CoTS then adds a weak-strong ensemble over views to raise accuracy while keeping calibration.
Motivation
The paper begins by putting the existing fixes on one accuracy-ECE plot (its Figure 1, shown under Method). Two things stand out. First, the regularization methods (C-TPT, O-TPT, A-TPT, SoC) pull TPT’s ECE down only to roughly zero-shot CLIP’s level, not below it, and they give back accuracy on the way: with ViT-B/16 on the ImageNet variants, O-TPT ends at 57.51% against 60.74% for TPT and 57.22% for zero-shot, so almost the whole TPT gain is gone. Second, the post-hoc SaLS keeps TPT’s accuracy exactly but its ECE stays near 10%. No method keeps TPT’s accuracy and reaches zero-shot calibration at the same time.
Because TPT changes accuracy only a little while its ECE more than doubles, the authors suspect the damage is mainly a confidence shift, not wrong predictions. Their pilot, Confidence Replacement (CoR), tests this directly: keep the class TPT predicts and report zero-shot CLIP’s max probability as the confidence. This alone removes about 6 ECE points and beats SaLS and C-TPT. CoR is still worse than A-TPT and SoC, and it mixes a class from one distribution with a confidence from another. The insight CoTS builds on is that zero-shot confidence is a label-free target for calibrating the adapted model, so one can fit a temperature toward it instead of copying it.
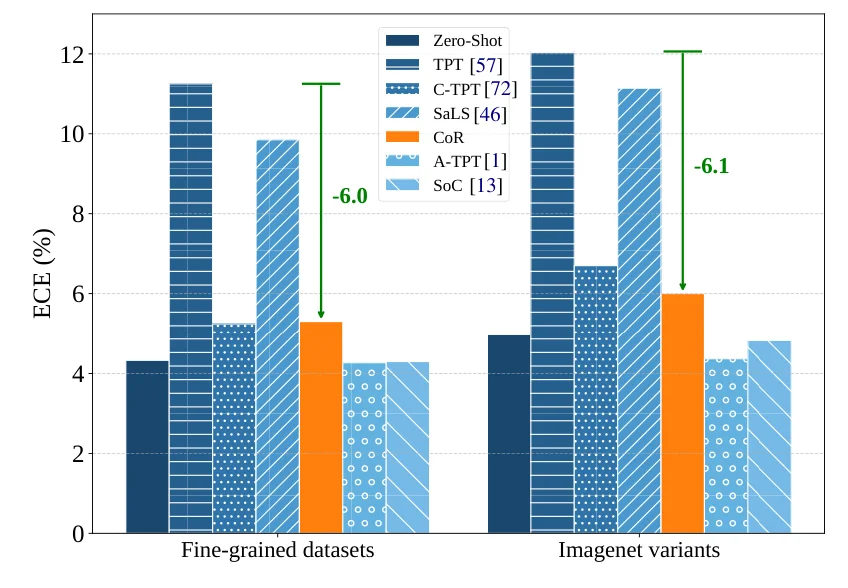 Average ECE of the confidence-replacement pilot (CoR, orange) against zero-shot CLIP, TPT and existing calibration methods with ViT-B/16. Only swapping in the zero-shot confidence cuts TPT’s ECE by 6.0 (fine-grained) and 6.1 (ImageNet variants) points, more than SaLS and C-TPT, though A-TPT and SoC remain lower. Figure from the paper.
Method
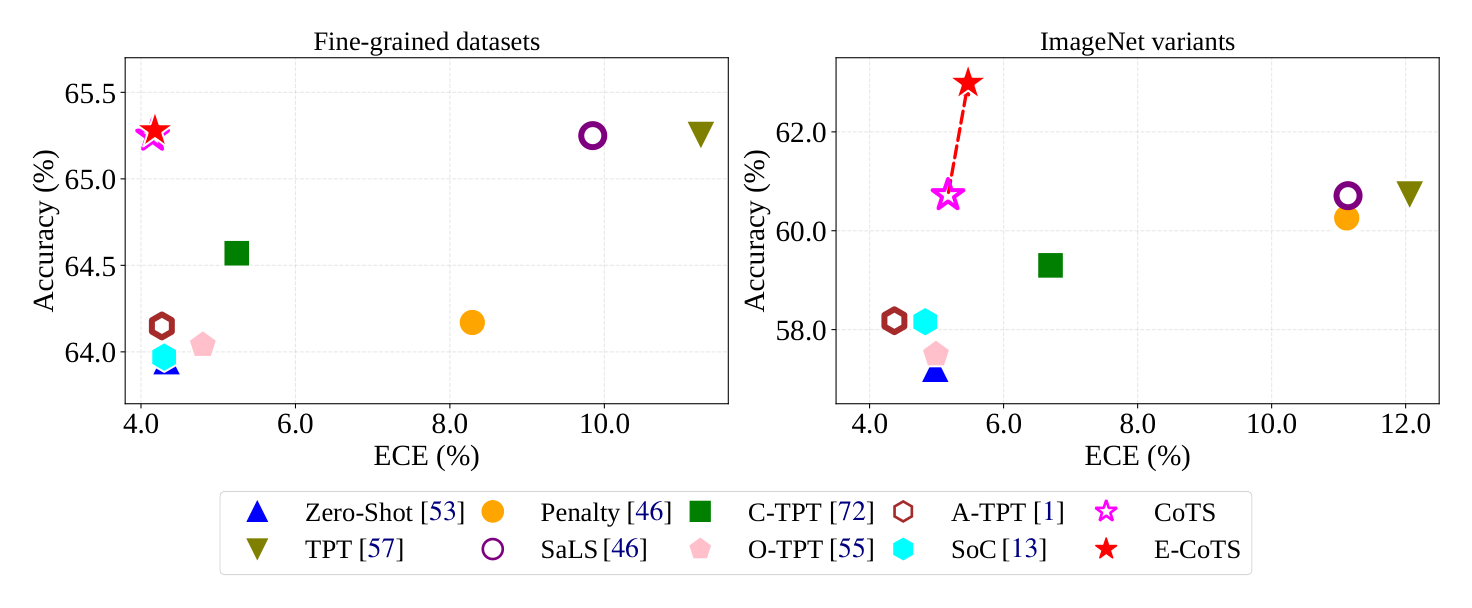 Average accuracy vs. ECE on 11 fine-grained datasets (left) and 4 ImageNet variants (right) with ViT-B/16. Regularization methods move left (lower ECE) but also down (lower accuracy). CoTS moves left at TPT’s accuracy, and E-CoTS also moves up. The paper has no separate pipeline figure; this is its motivating Figure 1. Figure from the paper.
Setup
CLIP computes logits \(\textbf{z}_{k}=(v^{T} t_{k})/\tau_{\text{clip}}\) between the image embedding \(v\) and the class text embedding \(t_k\). TPT builds 64 views of the test image: the weak view \(\mathcal{A}_1(x)\) (the original image) and 63 AugMix views. It keeps the 10% most confident views and minimizes the entropy of their averaged prediction, with one gradient step on the prompt. Let \(\textbf{z}^{tpt}\) and \(\textbf{z}^{zs}\) be the logits after and before tuning.
Pilot study: confidence replacement
For each sample, keep TPT’s predicted class but report the zero-shot max probability as the confidence. This “CoR” lowers ECE below SaLS and C-TPT, which suggests TPT’s miscalibration is mostly confidence inflation. But the class and the confidence then come from two different distributions. CoTS fixes this by changing only a temperature.
CoTS: temperature from the confidence gap
Standard temperature scaling fits \(\tau\) by minimizing NLL on a labeled validation set, which does not exist at test time. CoTS uses zero-shot confidence as the target instead. It selects strong views \(\Omega\) that have low entropy after adaptation (top 10%, excluding the weak view) and fits
\[\tau^{*}=\arg\min_{\tau}\frac{1}{|\Omega|}\sum_{i\in\Omega}\left(\max_{k}\hat{\textbf{p}}^{tpt}_{k}(\mathcal{A}_{i}(x);\tau)-\max_{k}\textbf{p}_{k}^{zs}(\mathcal{A}_{i}(x))\right)^{2},\]where \(\hat{\textbf{p}}^{tpt}(\cdot;\tau)\) is the softmax of \(\textbf{z}^{tpt}/\tau\). The temperature is trained for 50 steps. The output is \(\hat{\textbf{p}}^{tpt}(\mathcal{A}_1(x);\tau^{*})\), the weak view at the fitted temperature. Since one positive temperature does not change the argmax, accuracy is exactly TPT’s. Fitting on many strong views instead of just the weak one gives more variation in confidence; the ablation shows weak-view-only fitting is worse than CoR.
E-CoTS: weak-strong ensemble
To also gain accuracy, E-CoTS averages the weak view with the selected strong views, each at the fitted temperature:
\[\hat{\textbf{p}}_{ens}=\alpha\cdot\hat{\textbf{p}}^{tpt}(\mathcal{A}_{1}(x);\tau^{*})+(1-\alpha)\cdot\frac{1}{|\Omega|}\sum_{i\in\Omega}\hat{\textbf{p}}^{tpt}(\mathcal{A}_{i}(x);\tau^{*}).\]The weight is the mean pairwise cosine similarity of the \(K\) text embeddings, \(\alpha=\frac{1}{K(K-1)}\sum_{i\neq j}t_{i}^{T}t_{j}\). When class texts are similar, entropy-based view selection is less reliable, so the original image gets more weight. This \(\alpha\) depends only on the text side, so it is set per task without tuning. The paper reports that the ensemble alone raises accuracy but hurts calibration, which is why the temperature is applied inside it.
Both CoTS and E-CoTS run after adaptation, so they can be stacked on any of the regularization methods.
Main Experiments
Backbone ViT-B/16 and ResNet-50, single-sample episodic TPT, mean of 3 seeds. Metrics are average top-1 accuracy (%) and ECE (%) over 11 fine-grained datasets and over ImageNet-A/V2/R/Sketch. The table is the paper’s Table 6 (the averages of Tables 1, 2 and the ResNet-50 appendix tables). Penalty and SaLS are from Murugesan et al. (ECCV 2024).
| Method | ViT FG Acc | ViT FG ECE | ViT IN-var Acc | ViT IN-var ECE | RN50 FG Acc | RN50 FG ECE | RN50 IN-var Acc | RN50 IN-var ECE |
|---|---|---|---|---|---|---|---|---|
| Zero-shot | 63.95 | 4.33 | 57.22 | 4.98 | 56.04 | 5.38 | 40.70 | 7.09 |
| TPT | 65.19 | 11.30 | 60.74 | 11.90 | 58.06 | 11.31 | 43.83 | 17.55 |
| C-TPT | 64.57 | 5.23 | 59.25 | 6.67 | 57.69 | 6.44 | 42.75 | 13.14 |
| Penalty | 64.21 | 8.28 | 60.24 | 10.99 | 57.52 | 8.41 | 43.66 | 17.02 |
| SaLS | 65.20 | 9.94 | 60.74 | 10.98 | 58.06 | 9.31 | 43.83 | 15.37 |
| O-TPT | 64.05 | 4.77 | 57.51 | 4.97 | 57.36 | 5.67 | 40.82 | 6.46 |
| A-TPT | 64.12 | 4.33 | 58.20 | 4.34 | 57.30 | 4.55 | 41.94 | 7.76 |
| SoC | 63.95 | 4.31 | 58.12 | 4.87 | 56.19 | 5.50 | 41.61 | 7.52 |
| CoTS | 65.19 | 4.28 | 60.74 | 5.30 | 58.06 | 5.04 | 43.83 | 6.87 |
| E-CoTS | 65.22 | 4.31 | 62.95 | 5.38 | 57.72 | 5.04 | 45.39 | 7.24 |
Plug-in on other methods (ViT-B/16, from Table 3). Accuracy / ECE of each base method, and after adding E-CoTS.
| Base | FG base | FG + E-CoTS | IN-var base | IN-var + E-CoTS |
|---|---|---|---|---|
| C-TPT | 64.57 / 5.23 | 64.64 / 4.16 | 59.25 / 6.67 | 62.74 / 5.14 |
| Penalty | 64.21 / 8.28 | 65.25 / 3.86 | 60.24 / 10.99 | 62.65 / 5.39 |
| O-TPT | 64.05 / 4.77 | 64.93 / 4.30 | 57.51 / 4.97 | 62.01 / 4.55 |
| A-TPT | 64.12 / 4.33 | 65.07 / 3.85 | 58.20 / 4.34 | 62.32 / 4.87 |
| SoC | 63.95 / 4.31 | 65.01 / 4.20 | 58.12 / 4.87 | 61.84 / 4.58 |
CoTS keeps TPT’s accuracy by construction and brings ECE close to zero-shot level; on ViT-B/16 fine-grained it has the lowest ECE in the table. It is not the best ECE everywhere: A-TPT is lower on ImageNet variants (4.34 vs. 5.30) and on RN50 fine-grained, and O-TPT is lower on RN50 ImageNet variants. E-CoTS gives the largest accuracy gain on the ImageNet variants (62.95 vs. 60.74 for TPT with ViT-B/16) and lifts the accuracy of every regularization method it is added to, though on ImageNet variants it raises ECE for A-TPT (4.34 to 4.87).
The ablation in Figure 3 checks which views the temperature is fitted on and which distance is used. Fitting on the weak view alone is no better than CoR, while the top 6 strong views give the lowest ECE; the choice of L1, L2 or L-infinity distance barely matters. These ablation numbers are from the paper’s ablation runs and differ slightly from the main table.
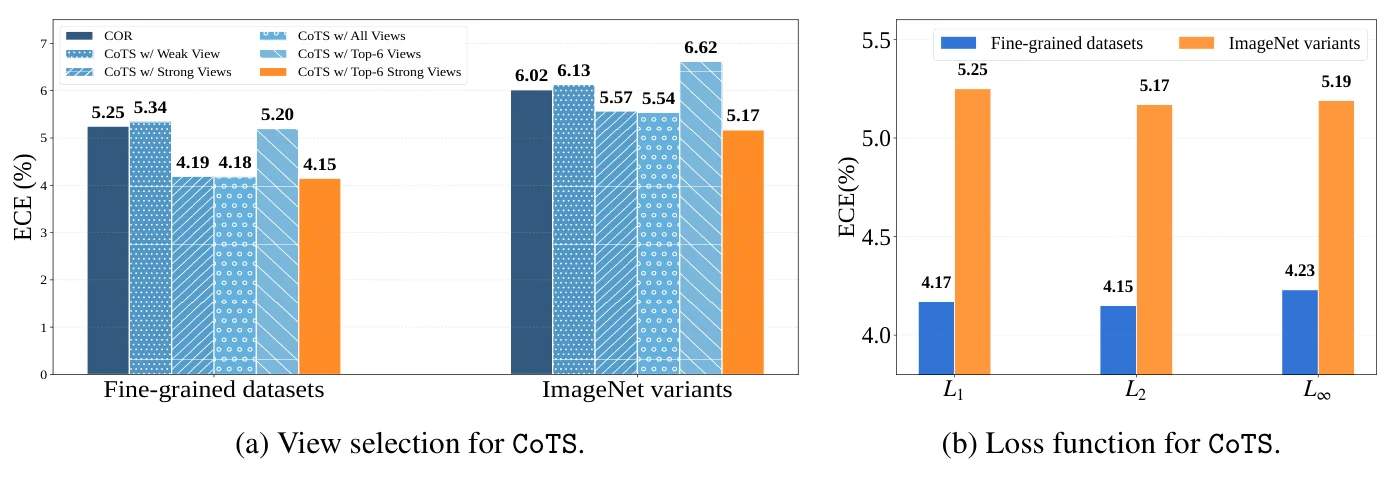 Ablation of CoTS with ViT-B/16: (a) which views the temperature is fitted on, (b) the distance used in the confidence-matching loss. Fitting on strong views (orange, top 6) beats the weak view and CoR on both benchmarks; the loss choice changes ECE by less than 0.1 point. Figure from the paper.
The appendix reliability diagrams compare A-TPT with CoTS and E-CoTS on DTD, Flowers, Pets and ImageNet-V2. CoTS and E-CoTS stay close to the diagonal about as well as A-TPT while keeping TPT’s predictions, and the largest remaining gaps sit in sparse low-confidence bins.
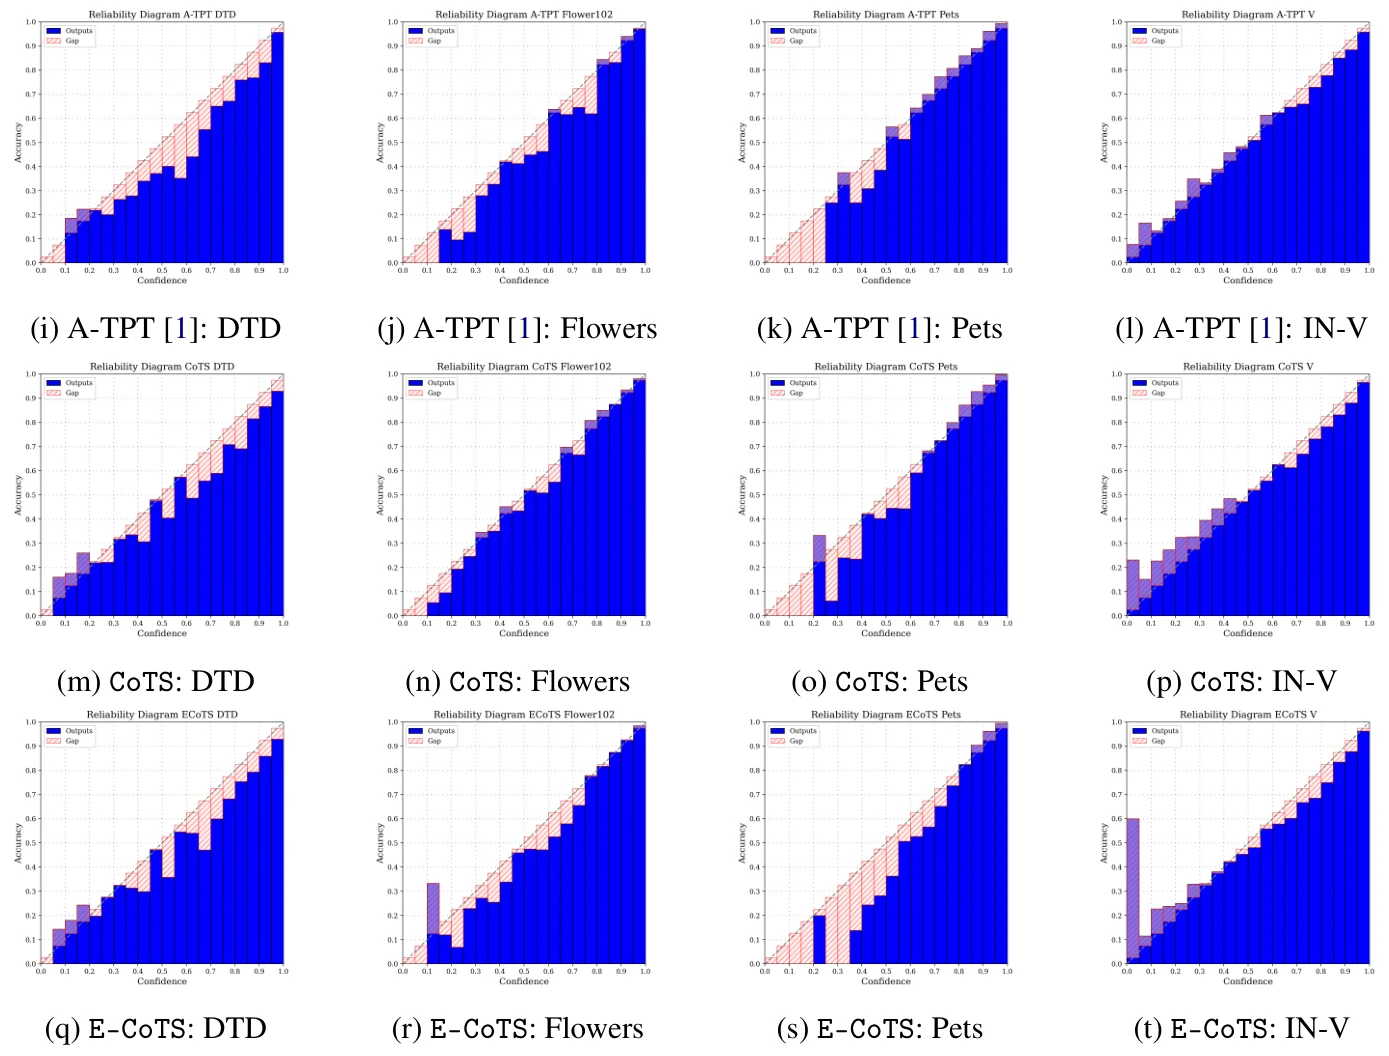 Reliability diagrams of A-TPT (top), CoTS (middle) and E-CoTS (bottom) on DTD, Flowers, Pets and ImageNet-V2. Bars close to the diagonal mean calibrated confidence; the visible gaps are mostly in low-confidence bins with few samples, such as the first bin of E-CoTS on ImageNet-V2. Figure from the paper.
Limitations
- Scope (stated by the authors). Only classification is evaluated. Segmentation, detection, and adversarial robustness are left open.
- Extra compute (stated by the authors). The temperature fit adds about 0.053 to 0.054 s per sample on top of TPT’s 0.19 to 0.22 s (DTD and ImageNet-A, ViT-B/16), and it needs zero-shot logits for all views.
- Calibration is capped by zero-shot. The target is zero-shot confidence, so CoTS can at best inherit zero-shot CLIP’s calibration. In the table its ECE stays near zero-shot ECE, and with ViT-B/16 on ImageNet variants it is above it (5.30 vs. 4.98). If zero-shot CLIP were badly calibrated on some domain, the method has no correction for that.
- Ranking is not improved by CoTS alone. A single temperature per sample does not change which class is predicted. Any accuracy gain comes from the ensemble in E-CoTS.
- E-CoTS can trade back some calibration. On ImageNet variants with ViT-B/16, E-CoTS has slightly higher ECE than CoTS (5.38 vs. 5.30), and on RN50 fine-grained its accuracy is below TPT’s (57.72 vs. 58.06).
- Preprint. The paper is an arXiv preprint and has not been peer reviewed.