Abstract
Test-time prompt tuning (TPT) improves CLIP’s zero-shot accuracy by tuning the prompt on each unlabeled test image with an entropy-minimisation objective. Entropy minimisation makes predictions more confident, and the paper shows that this makes TPT poorly calibrated: its confidence no longer matches how often it is right. Standard fixes such as temperature scaling or trainable calibration losses need labeled data, which does not exist at test time.
The paper looks for a label-free signal inside CLIP itself. Across many hand-crafted prompts with similar accuracy, the prompts whose class text features are more spread out give lower calibration error. The authors measure this spread with the Average Text Feature Dispersion (ATFD) and add \(-\text{ATFD}\) as a regulariser to TPT. The result, C-TPT, keeps most of TPT’s accuracy gain and roughly halves its expected calibration error (ECE) on the fine-grained benchmarks.
Motivation
The paper builds its case in three steps, all shown on StanfordCars with CLIP-ViT-B/16. First, the problem: with the hard prompt “an example of {class}”, zero-shot CLIP reaches 64.6% accuracy with an ECE of 2.49. After TPT, accuracy rises to 67.3% but ECE jumps to 6.26, and the reliability diagram shows the bars falling below the diagonal in almost every confidence bin, which is overconfidence. Entropy minimisation rewards confident predictions, so this is the expected side effect.
Second, a hint that the prompt controls calibration: across 80 hand-crafted templates, most prompts land between about 60% and 66% accuracy, but their ECE ranges from about 2 to 8. Third, a candidate explanation: among prompts with nearly identical accuracy (61.9 to 62.2), the ones with high ECE (8.55, 9.02) have text features packed into a small region of the t-SNE plot, while the low-ECE ones are spread out.
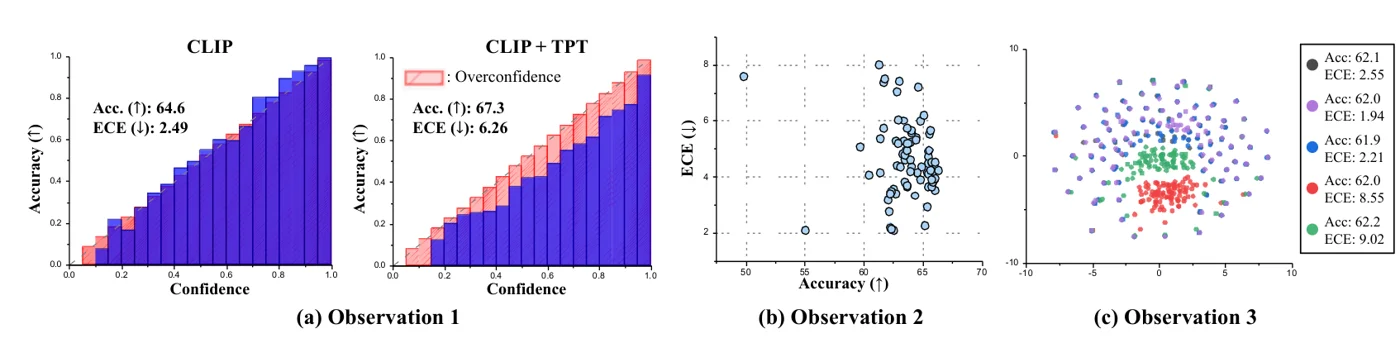 (a) Reliability diagrams for CLIP and CLIP + TPT on StanfordCars; the red hatched area is the overconfidence added by TPT. (b) Accuracy vs. ECE for 80 hard prompt templates: similar accuracy, very different ECE. (c) t-SNE of class text features for five prompts of about 62% accuracy; the two badly calibrated prompts (red, green) are clustered in the middle. Figure from the paper.
To turn the t-SNE impression into something measurable, the authors define ATFD and check it on many datasets. For prompts within 3% of each dataset’s best accuracy, higher ATFD goes with lower ECE on almost every dataset, on both backbones. This correlation is the label-free signal the method needs: dispersion can be computed from the text features alone, at test time.
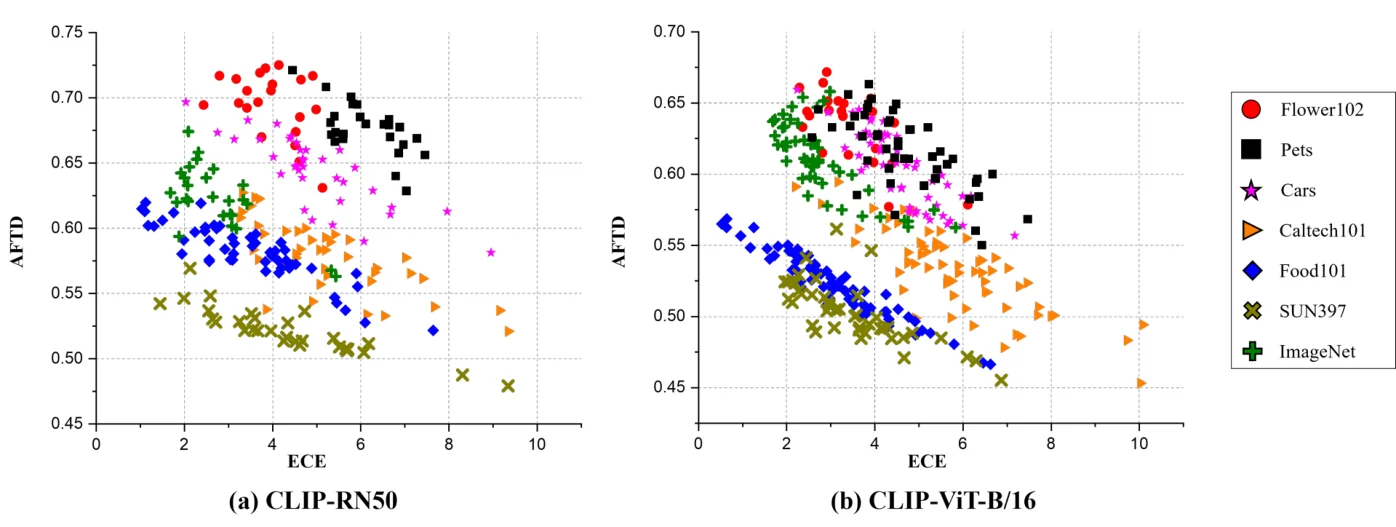 ATFD (y-axis, labelled AFTD in the plot) vs. ECE for hard prompts with near-best accuracy, for seven datasets with CLIP-RN50 (a) and CLIP-ViT-B/16 (b). Within each dataset, points slope downward: more dispersion, lower calibration error. Average Pearson correlation is -0.70 and -0.76. Figure from the paper.
Method
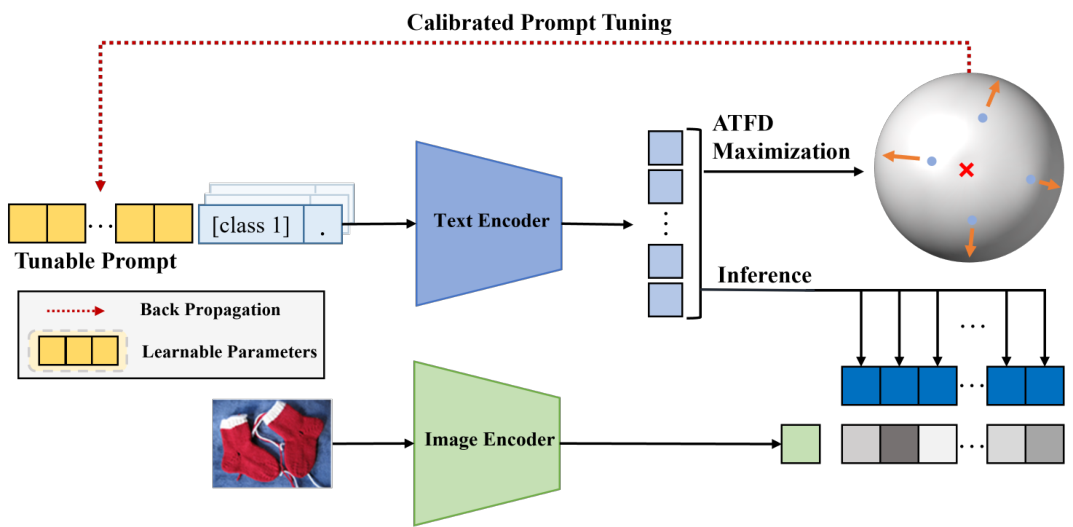 C-TPT. The tunable prompt is combined with every class name and passed through the text encoder. During test-time tuning, the dispersion of the resulting class text features (ATFD) is maximised alongside the TPT loss. The tuned text features are then used for inference with the image feature. Figure from the paper.
Three observations
The method rests on three observations, mostly shown with CLIP-ViT-B/16.
- TPT increases calibration error. Reliability diagrams on StanfordCars show TPT raising accuracy over a hard prompt but becoming overconfident.
- Prompts with similar accuracy can have very different ECE. Over 80 hand-crafted CLIP templates, ECE varies widely at the same accuracy level.
- Well-calibrated prompts have dispersed text features. In t-SNE plots, the class text features of poorly calibrated prompts collapse into a tight cluster. The features of well-calibrated prompts are spread out and sit near their own class.
The image feature does not depend on the prompt, so any calibration difference between prompts must come from the text side. This is why the paper focuses on the geometry of the text features.
Average Text Feature Dispersion
For a prompt \(\mathbf{p}\) and \(N\) classes, let \(\mathbf{t}_{[\mathbf{p};y_i]}\) be the text feature of the description “\(\mathbf{p}\) + class \(y_i\)”. The centroid of the class features is
\[\mathbf{t}_{\text{centroid}} = \frac{1}{N}\sum_{i=1}^{N} \mathbf{t}_{[\mathbf{p};y_i]},\]and ATFD is the mean L2 distance from that centroid:
\[\text{ATFD} = \frac{1}{N}\sum_{i=1}^{N} \left\| \mathbf{t}_{\text{centroid}} - \mathbf{t}_{[\mathbf{p};y_i]} \right\|_2 .\]The authors take hard prompts whose accuracy is within 3% of the best prompt on each dataset and compare their ATFD and ECE. The Pearson correlation between ATFD and ECE averages \(-0.70\) for CLIP-RN50 and \(-0.76\) for CLIP-ViT-B/16 across datasets.
Calibrated test-time prompt tuning
C-TPT adds the negative ATFD to the TPT objective:
\[\mathbf{p}^{*} = \arg\min_{\mathbf{p}} \left[ \mathcal{L}_{\text{TPT}} + \lambda \cdot \mathcal{L}_{\text{C-TPT}} \right], \qquad \mathcal{L}_{\text{C-TPT}} = -\text{ATFD}\left(\mathbf{t}_{[\mathbf{p};y_1]}, \dots, \mathbf{t}_{[\mathbf{p};y_N]}\right).\]\(\mathcal{L}_{\text{TPT}}\) is the usual TPT loss: the entropy of the averaged prediction over confident augmented views of the test image. The new term needs only the text features of the class descriptions, so it uses no labels and no image statistics. Both terms update only the prompt embeddings, and both CLIP encoders stay frozen.
The setup follows TPT: the prompt starts from “a photo of a”, gets one AdamW step with learning rate 0.005, and all other TPT settings are kept. \(\lambda\) is 50.0 for the fine-grained datasets and 20.0 for the ImageNet variants. The paper also reports an ensemble setting, where four hard-prompt initialisations (“a photo of a”, “a photo of the”, “a picture of a”, “a picture of the”) are each tuned and their logits averaged.
In a t-SNE analysis on Caltech101, prompts tuned with plain TPT give clustered text features, like the poorly calibrated hard prompts. Increasing \(\lambda\) spreads them out, and they group by class.
Main Experiments
Backbones are CLIP-RN50 and CLIP-ViT-B/16. Metrics are top-1 accuracy (%, higher is better) and ECE (%, lower is better). The tables show only the Average column of the paper’s Tables 1 and 2, for the hard-prompt and ensemble initialisations.
Fine-grained classification, average over 11 datasets (ImageNet, Caltech, Pets, Cars, Flower, Food101, Aircraft, SUN397, DTD, EuroSAT, UCF101)
| Setting | RN50 Acc. | RN50 ECE | ViT-B/16 Acc. | ViT-B/16 ECE |
|---|---|---|---|---|
| CLIP (hard prompt) | 55.9 | 5.61 | 63.7 | 4.43 |
| + TPT | 57.7 | 11.7 | 65.0 | 11.6 |
| + TPT + C-TPT | 57.8 | 6.20 | 64.8 | 5.13 |
| CLIP (ensemble) | 57.1 | 5.58 | 64.2 | 5.82 |
| + TPT | 58.2 | 10.7 | 65.5 | 9.91 |
| + TPT + C-TPT | 58.5 | 5.20 | 65.8 | 4.62 |
Natural distribution shifts, average over ImageNet-A, -V2, -R, -Sketch
| Setting | RN50 Acc. | RN50 ECE | ViT-B/16 Acc. | ViT-B/16 ECE |
|---|---|---|---|---|
| CLIP (hard prompt) | 40.6 | 7.46 | 57.2 | 5.04 |
| + TPT | 43.5 | 16.7 | 59.9 | 12.0 |
| + TPT + C-TPT | 42.8 | 12.1 | 59.6 | 5.82 |
| CLIP (ensemble) | 42.0 | 9.06 | 58.4 | 6.10 |
| + TPT | 44.5 | 15.8 | 61.2 | 10.9 |
| + TPT + C-TPT | 44.0 | 13.6 | 60.7 | 8.32 |
TPT raises ECE by 1.7x to 2.6x in every setting. Adding C-TPT cuts the ECE of TPT by about half on the fine-grained datasets (47% to 56% lower) with almost no change in average accuracy. The gain is smaller under natural distribution shifts (14% to 52% lower ECE), and C-TPT costs up to 0.7 points of average accuracy there. In most settings the C-TPT ECE is still above that of the untuned CLIP prompt. In a separate comparison on ViT-B/16, C-TPT gives lower average ECE than TPT with a temperature learned on labeled ImageNet.
That comparison is worth a closer look, because temperature scaling is the standard fix and here it gets labeled data that C-TPT never sees. The learned temperature does lower TPT’s ECE on most datasets, but C-TPT is lower still on most of them, with the clearest gaps on Aircraft, SUN397, UCF101 and the ImageNet variants. Temperature scaling wins on Flower102 and Food101.
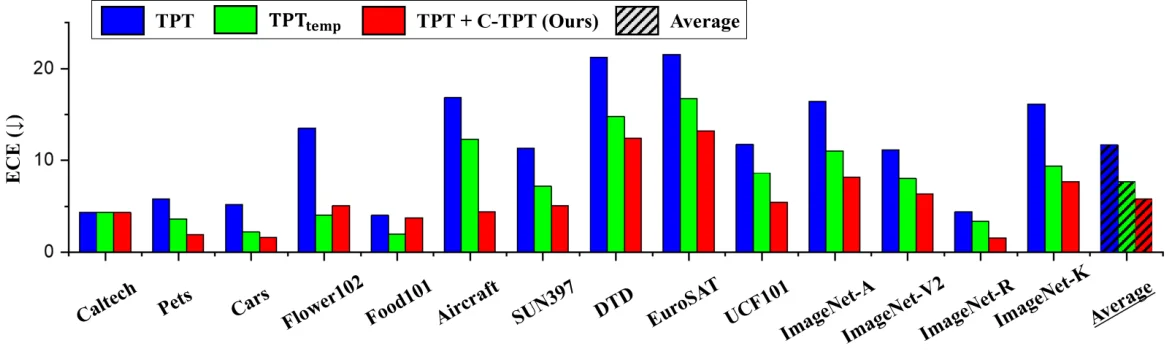 ECE per dataset with CLIP-ViT-B/16 for TPT (blue), TPT with a temperature learned on labeled ImageNet (green), and TPT + C-TPT (red). C-TPT has the lowest average without using any labels. Figure from the paper.
The t-SNE analysis (Section 7.2) checks that the regulariser changes the geometry in the intended way. With hard prompts on Caltech101, the badly calibrated templates form dense blobs regardless of class. Plain TPT produces a similar central blob (ATFD 0.423, ECE 5.04). With C-TPT and increasing \(\lambda\) (45, 50, 55), ATFD rises to 0.567, ECE drops to 1.98, and the features group by class.
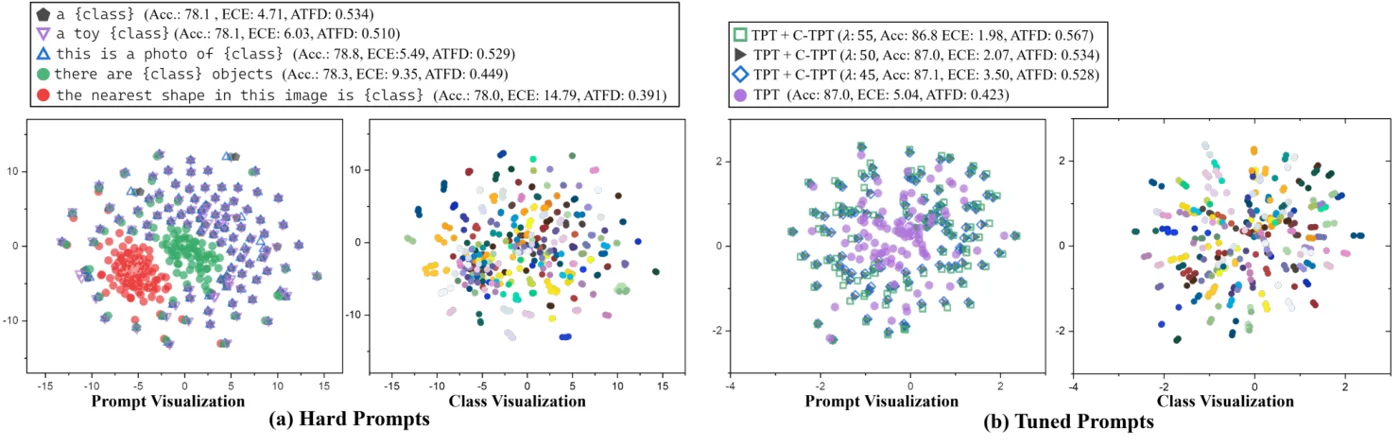 t-SNE of class text features from CLIP-RN50 on Caltech101. (a) Hard prompts with similar accuracy; poorly calibrated prompts (red, green) cluster together. (b) TPT (purple) clusters in the center, while TPT + C-TPT spreads the features out as \(\lambda\) grows. Figure from the paper.
Limitations
- Small accuracy drops (stated by the authors). Like other regularisation-based calibration methods, C-TPT sometimes lowers accuracy. Examples are RN50 on ImageNet-A (25.2 to 23.4 with the hard prompt) and ViT-B/16 on UCF101 (67.3 to 65.7).
- \(\lambda\) cannot be tuned at test time (stated by the authors). They choose it from validation-set trends where ECE and ATFD saturate, and note it may not be optimal per sample. The appendix describes a single value of 50.0, but the natural-shift experiments use 20.0, so in practice the value differs by benchmark.
- Calibration is improved, not solved. On ImageNet-A with RN50, ECE stays at 25.4 (hard prompt) and 27.0 (ensemble). On DTD it stays between 11.9 and 19.8 across the four settings.
- Correlational motivation. The ATFD/ECE link is an empirical correlation over hard prompts with similar accuracy, and the explanation in Section 7.2 is qualitative, based on t-SNE plots.
- Inherits TPT’s cost. Each test image still needs 64 augmented views and a backward pass through the text encoder. The ATFD term needs the text features of all classes, which the TPT forward pass already computes.