Abstract
Contrastive decoding (CD) is one of the most popular training-free tools against object hallucination in multimodal LLMs. Methods such as VCD, ICD and SID build a “contrastive” input meant to induce hallucination (a noised image, a disturbing instruction, or pruned image tokens), and subtract its logits from the original ones. Their main evidence is a consistent gain on the POPE benchmark.
This paper argues that the gain is a mirage. On POPE it comes from two factors that have nothing to do with hallucination. (1) CD shifts the answer distribution in one direction, toward “Yes”. Most POPE subsets are skewed toward “No”, so the shift happens to balance them. (2) The adaptive plausibility constraint that every CD method uses cuts the candidate set so hard that sampling becomes nearly greedy search, and greedy is much better than sampling on a yes/no task. To show this, the authors build spurious improvement methods that copy each factor without any notion of hallucination, and these match or beat CD.
Motivation
The papers that introduced CD tell a clear story: the contrastive input makes the model hallucinate, and subtracting it removes the hallucination. Nobody had checked whether the contrastive branch really induces hallucination, or what the subtraction does to the answers.
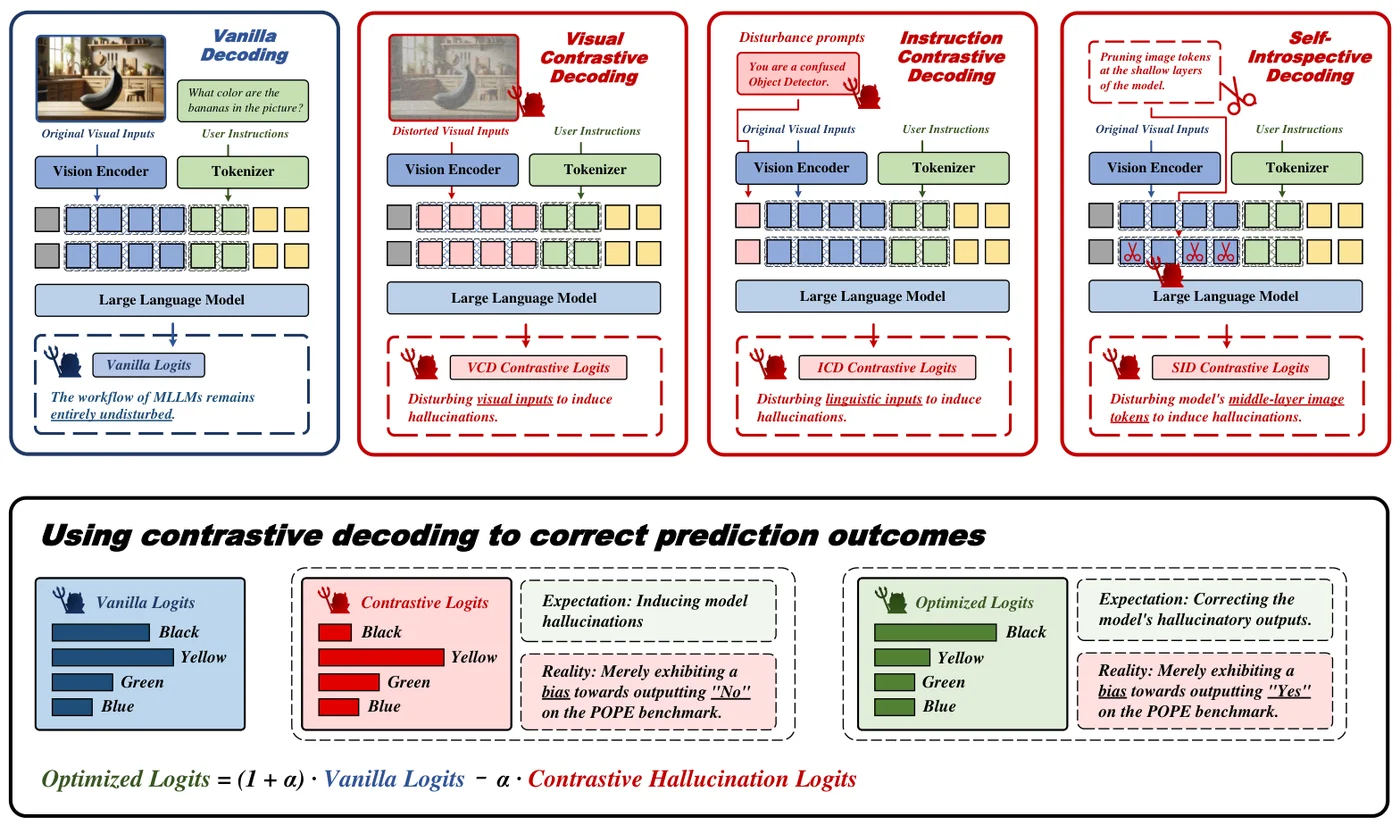 Top: vanilla decoding and the three CD variants. VCD distorts the image, ICD adds a disturbing instruction (“You are a confused object detector”), and SID prunes image tokens in early layers. Bottom: what the parts are expected to do versus what they do on POPE. The contrastive branch is supposed to hallucinate but is mainly biased toward “No”, so subtracting it biases the final answer toward “Yes”. Figure from the paper.
The first check is simple. With LLaVA-v1.5-7B and greedy decoding, the authors log both accuracy and the share of “Yes” answers:
| Method | COCO Random Acc | COCO Random Yes % | GQA Adversarial Acc | GQA Adversarial Yes % |
|---|---|---|---|---|
| Greedy | 87.1 | 39.2 | 80.9 | 54.0 |
| VCD | 88.6 | 46.4 | 78.0 | 63.3 |
| SID | 87.9 | 42.3 | 79.9 | 57.8 |
| VCD contrastive branch alone | 76.7 | 28.2 | 71.5 | 41.3 |
| SID contrastive branch alone | 79.0 | 23.6 | 74.2 | 43.1 |
Both methods raise the Yes rate on both subsets. On COCO Random, where the model starts biased toward “No” (39.2%), this helps. On GQA Adversarial, where it is already biased toward “Yes” (54.0%), the same shift hurts accuracy. The contrastive branches on their own are wrong mostly because they say “No” far too often (23.6-43.1% Yes), not because they hallucinate objects. Subtracting a “No”-biased branch can only push the final answer toward “Yes”.
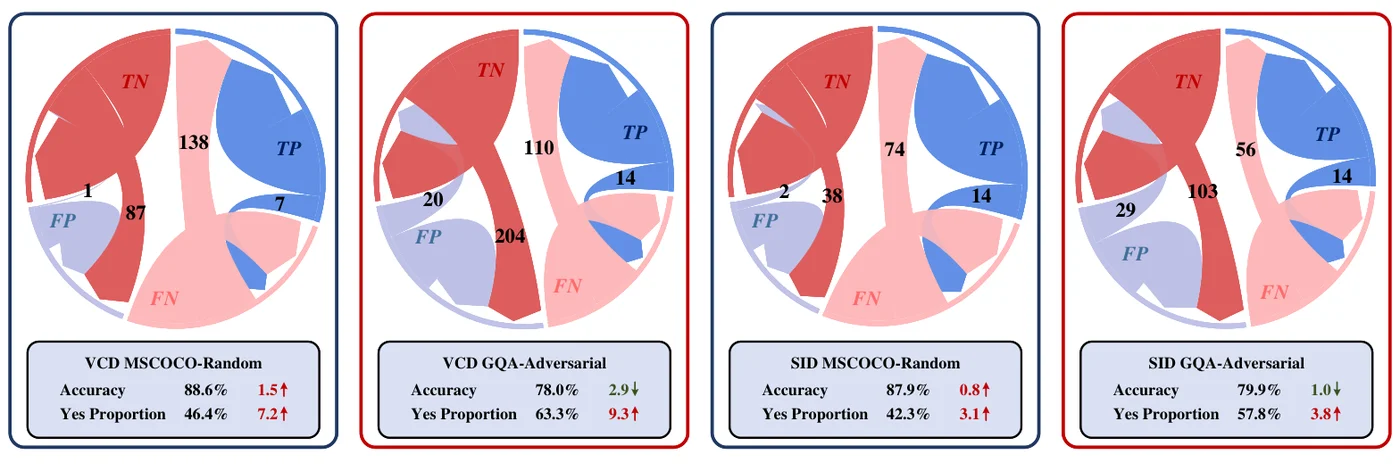 How predictions move after VCD and SID on COCO-Random and GQA-Adversarial. Most changes go from a negative answer to a positive one. On COCO this turns many false negatives into true positives, while on GQA it turns many true negatives into false positives. Figure from the paper.
Why does this still look like a win on POPE overall? Because the raw answer distribution of MLLMs is skewed toward “No” on most subsets.
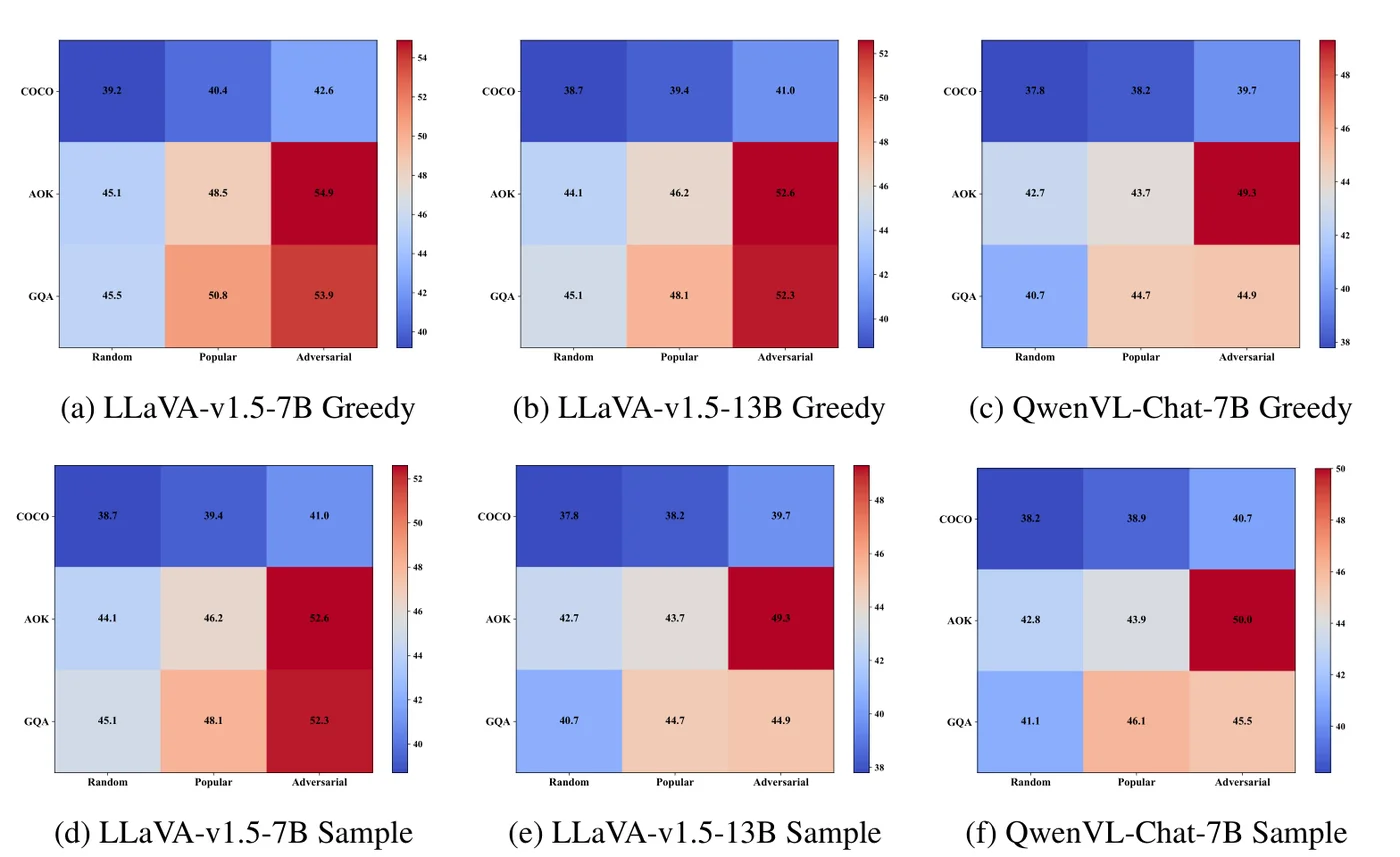 Share of “Yes” answers for LLaVA-v1.5-7B, LLaVA-v1.5-13B and QwenVL-Chat-7B, with greedy decoding (top) and sampling (bottom), on COCO, A-OKVQA and GQA under the random, popular and adversarial settings. The ground truth is 50%. All COCO cells are around 38-43%, so a push toward “Yes” helps there. Figure from the paper.
Method
The paper proposes no new mitigation method. Its method is a set of controlled baselines, each of which copies one suspected cause of the gain.
The two mechanisms under test
All three CD methods combine the vanilla logits with the logits of the contrastive input:
\[\mathrm{logit}_{cd} = (1 + \alpha)\, \mathrm{logit}_\theta(y \mid v, x) - \alpha\, \mathrm{logit}_\theta(y \mid v', x)\]They also apply the adaptive plausibility constraint, which keeps only tokens whose original probability is close to the top one:
\[\mathcal{V}_{\text{head}}(y_{<t}) = \{\, y_t \in \mathcal{V} : p_\theta(y_t \mid v, x, y_{<t}) \geq \beta \max_w p_\theta(w \mid v, x, y_{<t}) \,\}\]Tokens outside \(\mathcal{V}_{\text{head}}\) get probability zero. On a yes/no question, the model’s distribution is usually very peaked, so the constraint usually deletes the minority answer.
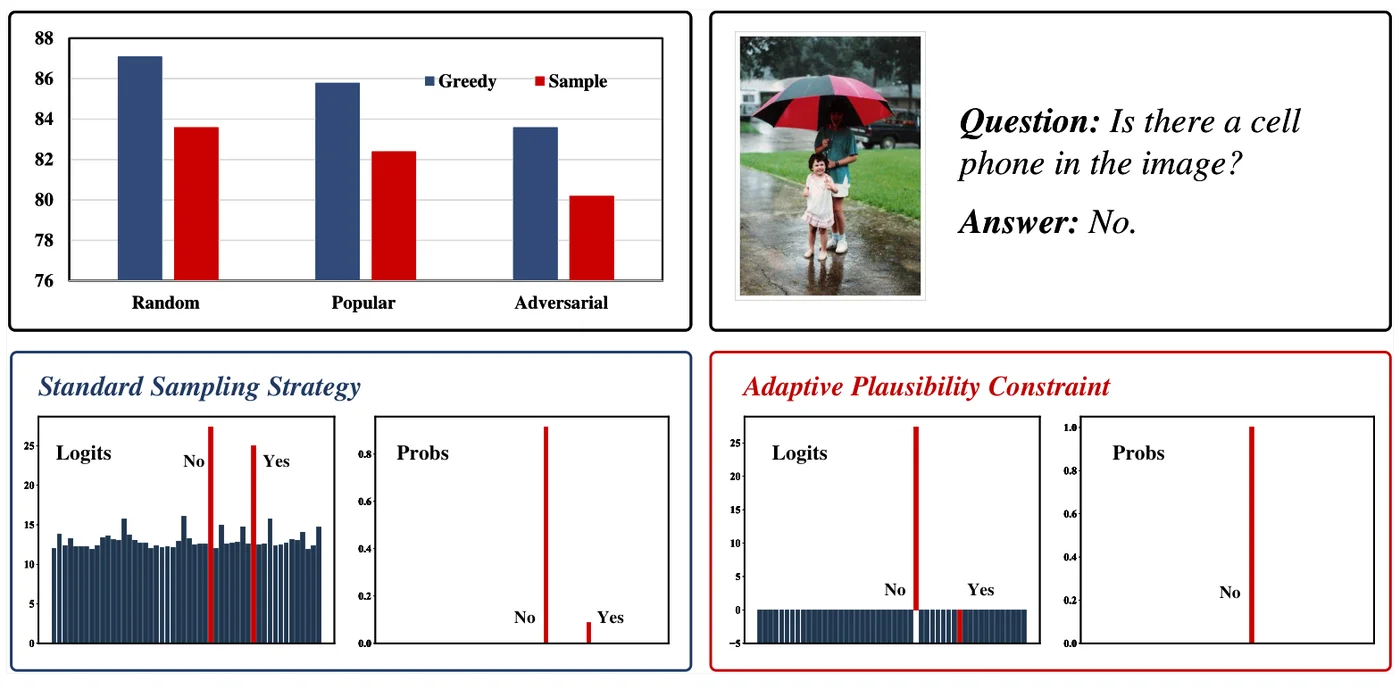 Top left: on POPE, greedy decoding beats plain sampling on all three settings. Bottom: for “Is there a cell phone in the image?”, LLaVA-v1.5-7B gives No 91.2% and Yes 8.8%. Plain sampling answers “Yes” 8.8% of the time. With the constraint, “Yes” is removed and sampling always returns “No”, just like greedy. Figure from the paper.
Spurious improvement methods
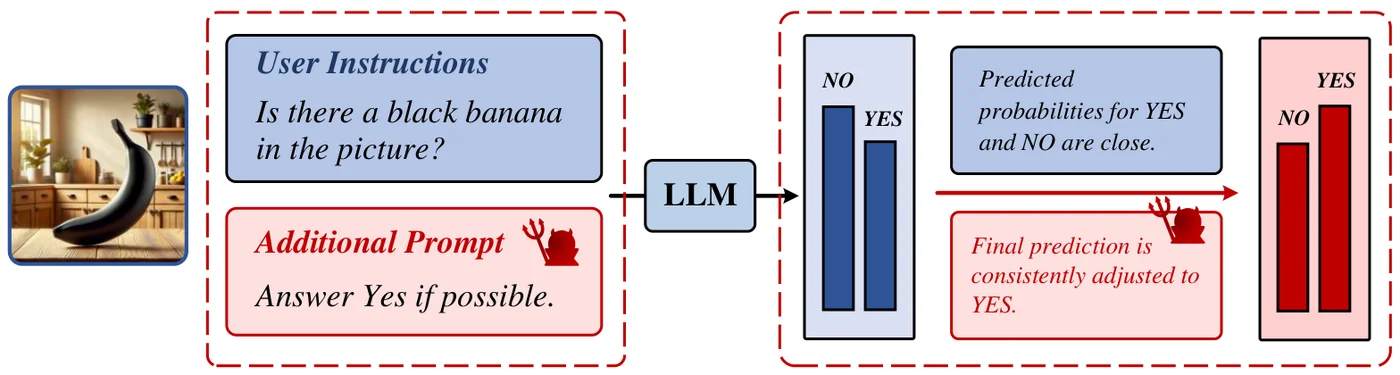 Two ways to push answers toward “Yes” without any hallucination reasoning. Left: append “Answer Yes if possible.” to the question. Right: when the probabilities of YES and NO are close, force the answer to YES. Figure from the paper.
- Prompt-Based Adjustment (PBA) appends “Answer Yes if possible.” to the user instruction.
- Output Layer Modification (OLM) sets the answer to “Yes” whenever \(\lvert p_\theta(\text{Yes}) - p_\theta(\text{No}) \rvert < \tau\).
- Sample† applies only the adaptive plausibility constraint to normal sampling, with no contrastive branch at all.
PBA and OLM copy factor (1) and are tested with greedy decoding on COCO, where the model is biased toward “No”. Sample† copies factor (2) and is tested with sampling on GQA, where the Yes rate is closer to balanced, so a Yes shift alone would not help.
Main Experiments
POPE on COCO, greedy decoding. Accuracy (%), with the Yes rate in parentheses.
| Setting | Method | LLaVA-v1.5-7B | LLaVA-v1.5-13B | QwenVL-Chat-7B |
|---|---|---|---|---|
| Random | Greedy | 87.1 (39.2) | 86.7 (38.7) | 85.9 (37.8) |
| Random | VCD | 88.6 (46.4) | 89.2 (44.4) | 87.7 (40.6) |
| Random | SID | 87.9 (42.4) | 87.2 (42.5) | 86.5 (39.9) |
| Random | PBA | 87.6 (40.2) | 90.2 (45.7) | 87.3 (41.5) |
| Random | OLM | 89.6 (44.2) | 90.0 (48.8) | 88.2 (43.8) |
| Adversarial | Greedy | 83.6 (42.6) | 84.3 (41.0) | 84.0 (39.7) |
| Adversarial | VCD | 81.9 (53.1) | 83.8 (49.7) | 84.5 (43.7) |
| Adversarial | SID | 82.3 (47.9) | 82.9 (46.9) | 83.2 (42.5) |
| Adversarial | PBA | 83.7 (44.0) | 84.5 (51.3) | 84.1 (45.2) |
| Adversarial | OLM | 83.6 (50.1) | 83.9 (54.9) | 84.8 (48.4) |
POPE on GQA with sampling, accuracy (%). Sample† is plain sampling plus the plausibility constraint only.
| Setting | Method | LLaVA-v1.5-7B | LLaVA-v1.5-13B | QwenVL-Chat-7B |
|---|---|---|---|---|
| Random | Sample | 83.8 | 84.6 | 81.5 |
| Random | VCD | 86.6 | 86.7 | 83.8 |
| Random | ICD | 85.2 | 85.8 | 82.5 |
| Random | SID | 84.9 | 86.0 | 82.9 |
| Random | Sample† | 85.4 | 86.1 | 83.0 |
| Adversarial | Sample | 75.1 | 78.2 | 76.4 |
| Adversarial | VCD | 76.4 | 80.3 | 78.6 |
| Adversarial | ICD | 75.8 | 79.2 | 76.8 |
| Adversarial | SID | 76.3 | 78.7 | 77.2 |
| Adversarial | Sample† | 76.3 | 79.5 | 77.9 |
- A one-line prompt or a threshold rule matches CD on COCO. OLM beats VCD in all 9 cells (three settings, three models), and PBA beats SID in 8 of 9. Accuracy rises while the Yes rate moves toward 50%. It falls again on the adversarial subset once the Yes rate goes past balance, the same pattern VCD shows.
- Under sampling, the constraint alone recovers most of the gain. Sample† beats ICD in every cell and matches or beats SID, and the authors report about 2.5% gain from the constraint alone. Its Yes rate barely moves (e.g. 45.6 to 45.1 on LLaVA-7B Random), so this gain is not a Yes shift.
- Outside POPE, CD does not help. With greedy decoding, VCD lowers MME perception from 1475.1 to 1389.9 and cognition from 349.6 to 294.6. It also raises CHAIR-S from 21.6 to 25.4 and CHAIR-I from 7.2 to 8.1, and lowers NoCaps (83.8 to 81.2) and LLaVA-Bench (65.7 to 64.6). SID behaves the same way. With sampling, Sample† gives the best numbers on all six metrics (e.g. MME-P 1282.1 to 1392.4, CHAIR-S 23.2 to 22.4). VCD and SID raise MME-P but make CHAIR worse.
Based on these results, the authors propose three rules for evaluating hallucination methods: control for the decoding strategy, check whether a method only shifts answers in one direction, and report how many correct answers a method breaks, not only how many wrong answers it fixes.
Limitations
- This is a critique, not a fix. The paper shows why CD looks good on POPE, but proposes no method that does reduce hallucination. Appendix C offers one explanation for the “No” bias of the contrastive branch: noise makes the model miss parts of the image. It backs this with a single qualitative example.
- The scope is narrow. All experiments use LLaVA-v1.5 (7B and 13B) and QwenVL-Chat-7B, with VCD, ICD and SID at their default settings. Newer CD variants, other \(\alpha\) and \(\beta\) values, and newer MLLMs are not tested. The generative benchmarks use a single backbone, which the table does not name.
- “Entirely unrelated” is a strong claim. The spurious baselines match the aggregate accuracy of CD. That does not prove CD never fixes a single hallucinated answer. A per-sample comparison (does OLM flip the same questions as VCD?) would make the argument tighter.
- Other papers show the same pattern. In the Nullu CHAIR table, VCD barely moves LLaVA-1.5 (CS 20.40 to 20.30). In MARINE’s Table 1, VCD makes LLaVA worse (CS 26.6 to 28.1). Both fit this paper’s finding that CD does not help generative hallucination metrics. The same Yes-rate check applies to audio-visual extensions of CD such as AVCD.